The Visual Display of Quantitative Lawsuits
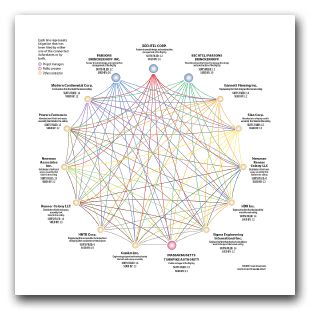
So the Boston Globe has this chart of who’s suing whom over failures in the “Big Dig:” (Click for a bigger version)
What I find most fascinating is that it’s both pretty and pretty useless. Since just about everyone is suing everyone else, what would be perhaps more interesting is a representation of who’s not suing whom. That is, where there is no lawsuit. I’ll use clock positions to describe players. With some work, I’ve determined that the Mass Turnpike Authority (at about 5.30) is not suing HNTB (7.30 or so), who is the “engineering firm responsible for inspections of Big Dig after completion of the projects.” HNTB is also not being sued by Newman Renner Colony (3.30), “distributor of bolt-and-epoxy assembly that failed in the ceiling.”
(Thanks to Nicko for the pointer.)
