First Impressions of the 2008 Ponemon Report
So the 2008 Ponemon breach survey is out and I’m reading through it, but I wanted to expand on the headline: “Ponemon Study Shows Data Breach Costs Continue to Rise.”
This is the report’s figure 3:
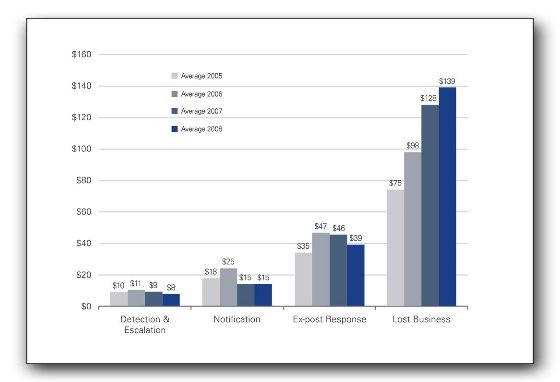
Left to right, those are “detection and escalation,” notification, “ex-post response” and “lost business.” I note that 2 fell, one is flat, and one rose. The lost business number is a survey estimate, an extrapolation.
I am, to be frank, somewhat skeptical of these lost business numbers. I think that the estimates are now at risk of being “self-feeding,” where people take one of the estimates they’ve seen from prior reports, and build an estimate on that, adding a little “because this is a bad one.”
I’m also pretty surprised to see that 5 industries reported churn rates above 5%. They are healthcare, financial, energy, communications, and ‘services.’ I’m not as skeptical here–these are easier to measure for both the reporter and the surveyor. I am surprised because at least health and financial can have pretty good lock in. I tend to agree with the analysis that “[The] growth in lost business costs demonstrates consumers do not take a breach of their trust and privacy lightly and have not become desensitized to the issue.”
So I’m pretty sure I have readers who have been involved in a breach response process. Can you comment (anonymously if you’d like) about how accurate you think these calculations are? What margin of error would you assign to your own organization’s estimates of lost business?
[Update: Black Fist has interesting and similar analysis in “Risk analysis: Cost of breaches and rolling your own numbers,” which I just saw.]
Fascinating how the “harder” costs are staying the same or slightly shrinking, while the “soft cost” increases dramatically. So how would, say, a TJX measure lost customers?
I suppose if you look at a 3 month business quarter, you could compare sales volume with both the same quarter last year and the industry average for sales this year, but that assumes a host of other variables (quality of product, marketing effectiveness, etc…) all stay the same.
Adam –
One of the things that I felt Ponemon did not control well for in the previous study was “captive relationships” and there impact on the overall churn rates. (They did not publish a churn # witch excluded captive relationships like government agencies, public schools, etc.)
Churn rates do tend to be quite high whenever the effected party has the choice to opt-out of the relationship.
If you have had a credit card reissued you may understand how oddly frustrating it is. Your bank doesn’t have a satisfying explanation as to why the card is being reissued. You have to update any payments you had automated with that card. The whole thing is inconvenient and odd.
Breach notifications are emotional for people because it puts them in touch with how little control they really have over very personal data, and one of the few remedies that they have to feel more in control is to end that business relationship – even if it is not at fault for causing the problem.
– Erik
An alternate way to view the space is to include the user’s cost of the breaches as well as the costs to the company. This might lead to a more sustainable, more mature solution 🙂 manual trackback, more on FC.
you note groupings in the graph and say you note decline or flat trends, but the totals over time in this graph show a rise. this is consistent with ponemon’s title:
2005 $138
2006 $171
2007 $195
2008 $201
perhaps some still use extrapolation but i have met with many who now have a very good idea of their real breach costs. a $4 million figure for tape loss i reviewed recently was based on sound accounting.
Perhaps I should also point out that the new breach disclosure requirement law in California (SB 541) coupled with the new privacy agency law (AB 211) for healthcare data allows patients to claim up to $1,000 in damages even if the exposure caused no harm.
I went into more detail in yesterday’s presentation. We might argue about the efficacy of the law, but it will certainly make breach cost calculations easier.
Davi, I said “I note that 2 fell, one is flat, and one rose.” which is not the same as “say you note decline or flat trends.”
What went into a $4M tape loss?
It’s okay to be skeptical of the lost business costs, but if you understand the methodology being employed in reaching these figures, you’d be less so. The Ponemon Institute does not arrive at these figures by looking at media reports, stock performance, and industry trends to then extrapolate figures. Each year the companies studied for this report allow the Ponemon Institute to come in and do a thorough analysis based on the actual impact on the company. Activity-based costing is the method used to examine lost business cost. We’re more than confident in the figures we publish.
Thanks Mike! I’d love to hear more about the methodology, and I suspect a lot of readers would as well. Would you be interested in doing a guest blog post?
Rather than a guest post, in which I wouldn’t be able to go into much more specific detail than what is included in the report itself (about 1/3 of the report is an explanation of methodology and terminology), I’ll just post here for anyone who is interested. The current report is available through PGP for the time being if you want to register and obtain a copy. Feel free to use this posting as you see fit.
A pretty good layman’s description of Activity Based Costing is found on Wikipedia (http://en.wikipedia.org/wiki/Activity-based_costing), including the methodology’s use of specific costs rather than arbitrary costs. Hey, I’m a layman myself — I don’t do the research — so I appreciate Wikipedia’s accessibility.
Once the Institute gets permission or invited to examine the cost impact, the process is very time intensive. Gathering and anylyzing the necessary data takes weeks. This study is unique among the many reports we produce each year, taking as much as three months from start to completion.
If there is any bias in the study it may be found in that we have access only to those companies that allow us access to the information, and we try to choose companies whose incidents are representative of data breaches in general. In doing this we also strive to study a variety of companies from different industries in order to make informed judgments related to impact within specific industries.
The good news is that each year more and more companies recognize the value in allowing us that privileged access, so the samples from which we can choose mean a better study result each year. That the results have been consistent say a lot about the reliability of the study as a body of work since 2005.
Mike,
Thank you for the disclosure! I’m quite impressed to hear that Ponemon used ABC – it’s a very intelligent approach to gaining “real” numbers for incident costs.
It would seem to me that using ABC to measure the cost of an incident would predicate that the company is already using a decently mature ABC system themselves, and if/when that’s *not* the case, I’d like to understand how you compensated.
Second, I’d like to know how you used ABC in determining that churn estimate. To be frank, I have no problem believing that Ponemon can get good cost center data from IRTs and effected LOBs and do a good job with that data. What I have a hard time putting faith in is the “lost customer” information. It would seem to me to have enough significant uncertainty as to warrant a probabilistic approach.
Thanks!